Debugging methods
- Use Safari’s built-in debugger with a cable connection; Chrome works similarly. See:Safari and Chrome debugging on real devices
- Method two: debug with spy-debugger
Debugging tool
spy-debugger is used to debug H5 layout issues on Android, iOS, and WebView. Traffic capture is mainly used in WebView. spy-debugger is convenient for layout debugging, needs no cable, and allows several people to debug at once.
Usage
-
Install:
- On Windows:
npm install spy-debugger -g - On macOS:
sudo npm install spy-debugger -g
- On Windows:
-
Start
- Enter in the terminal:
spy-debugger 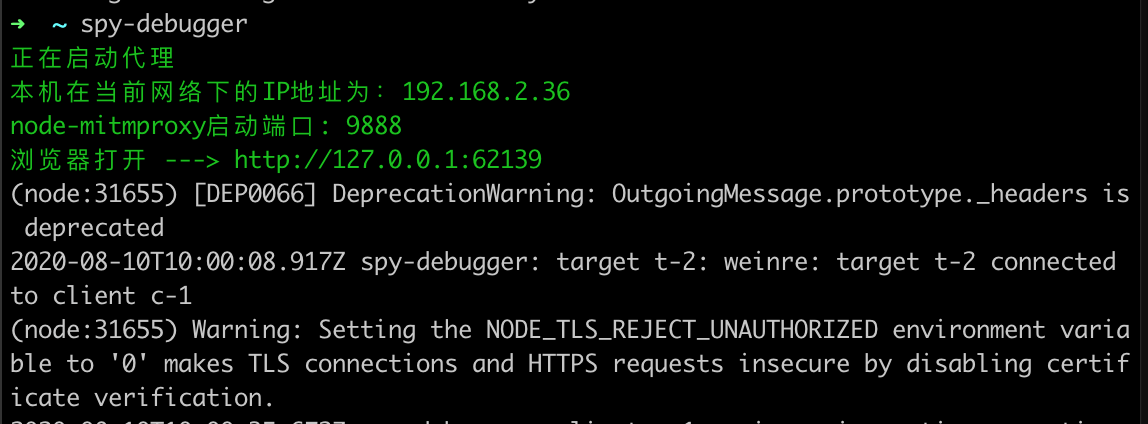
- Enter in the terminal:
-
Requirements before debugging
- The phone and computer must be on the same Wi-Fi
- Enter in the terminal:
spy-debuggerIf the command does not start on Windows or macOS, turn off the firewall and try again - Configure the phone’s HTTP proxy with the port shown above (default 9888) and your computer’s current IP address
- Android proxy setup: Settings → WLAN → long-press the network → Modify network → Advanced → Proxy settings → Manual
- iOS proxy setup: Settings → Wi-Fi → select the network → HTTP Proxy → Manual
iOS needs a certificate installed separately
- Open this address in Safari: Certificate installation , allow it, install, enter the password, and finish
How to access
- After configuring the port, enter in the phone browser the
spy-debuggerstartup IP and the port of your local project - For example, if the IP is 192.168.2.36 and the local project URL is
http://localhost:8080, the debugging URL ishttp://192.168.2.36:8080
Traffic capture
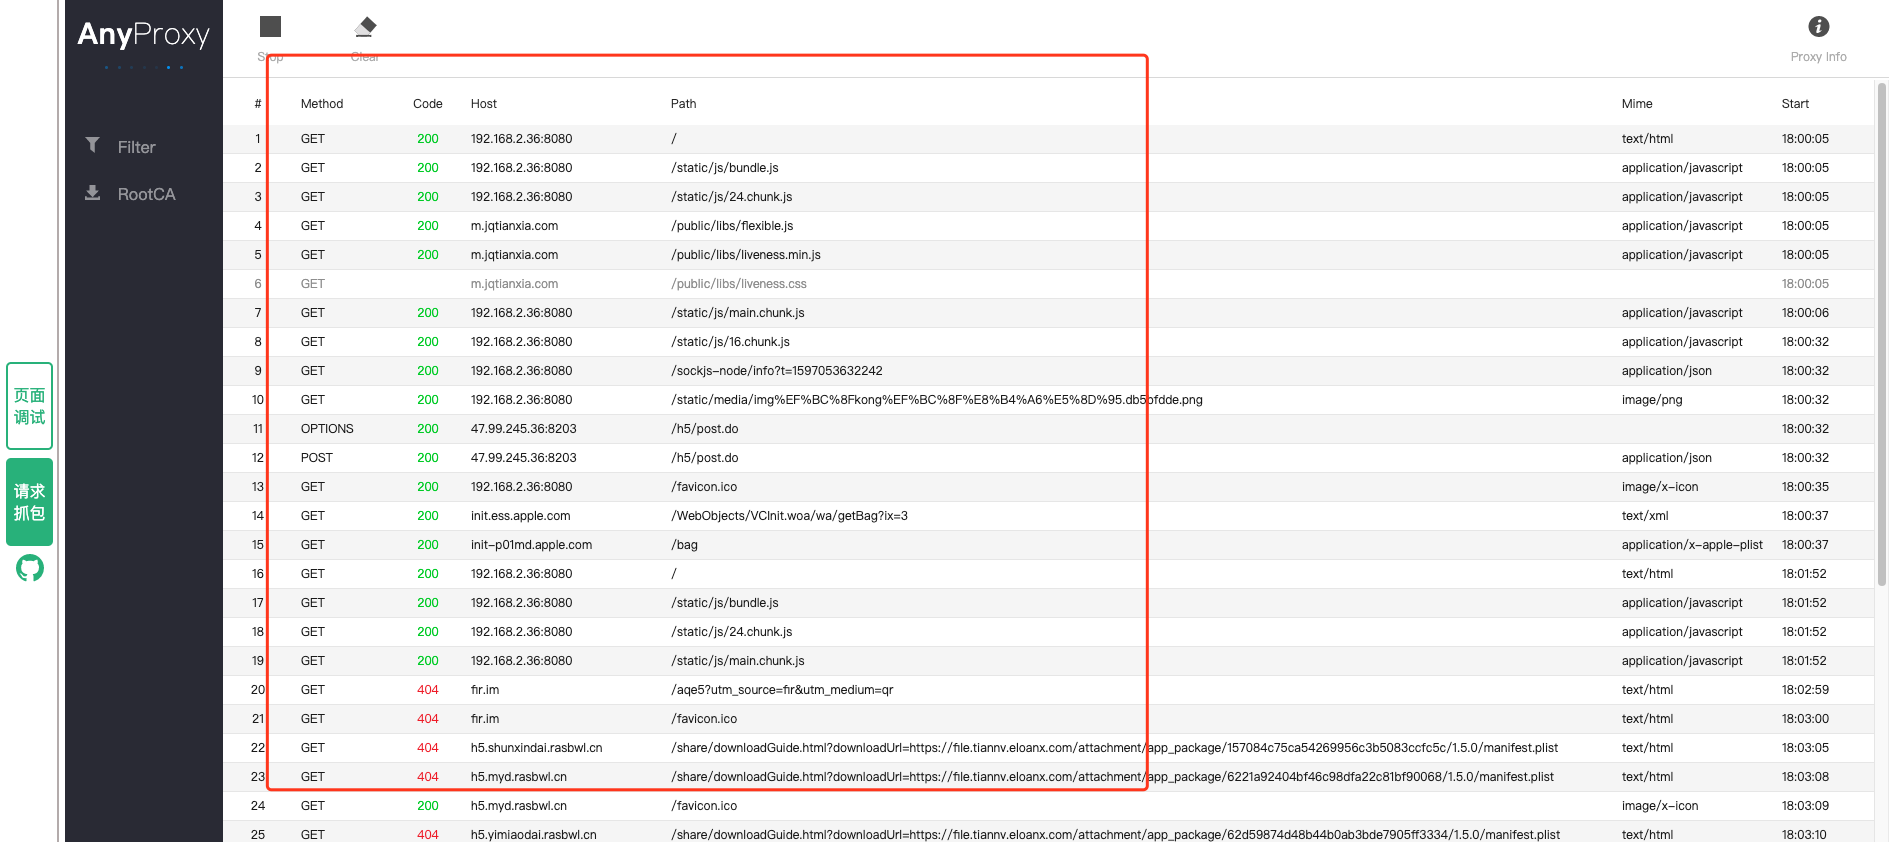
The method and host shown above identify requests from the debugger. Click a request to view its Response.
Customize the port and proxy
- Start on a specified port:spy-debugger -p 8888
- Set a proxy:spy-debugger -e http://127.0.0.1:7980
- For more custom settings, seethe documentation